International Foods
One honest view of where the money is, built around what they already ran.
International Foods imports American and international FMCG into New Zealand and sells it across supermarkets, service stations, wholesalers and its own stores. Their numbers lived in disconnected systems and a stack of spreadsheets, so no one could see true profit by channel, product or freight lane. We built a Power BI model that wraps around the spreadsheets they already work in, without disrupting the running business, and hands them one clear view of where margin is made and lost.
- Industry
- FMCG import and distribution
- Region
- Hamilton, New Zealand
- Scope
- Power BI profitability model
- Status
- Delivered, built to scale

 Power BIexecutive summary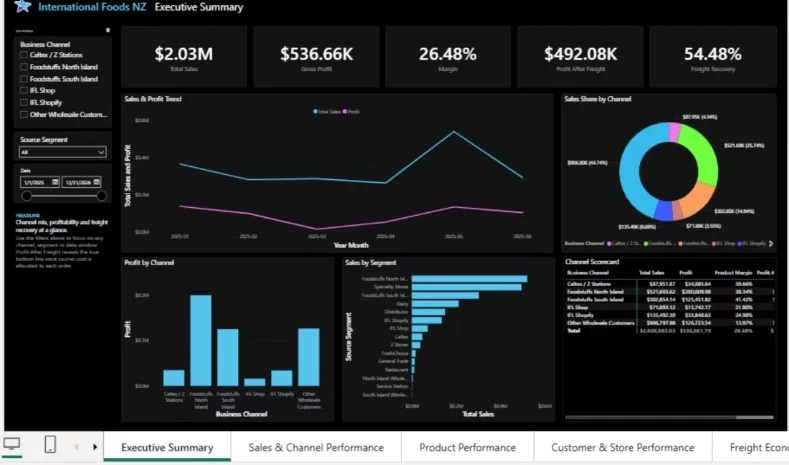
The problem
Profit in FMCG distribution hides in the gaps between systems. Sales sat in Unleashed and Shopify, costs in Xero, and freight in loose files, so a single true-profit number never existed. Pulling one together meant days of manual reconciliation, and even then freight was never tied back to the order.
Without freight at the order line, the question that mattered most stayed unanswered: which channels, products and customers actually make money once the courier is paid, and which quietly lose it.
What we built
Every channel's real margin, side by side
Revenue, margin and growth for each channel in one view, so the team can see at a glance where volume is healthy and where it is busy trading at a loss.
Power BIsales & channel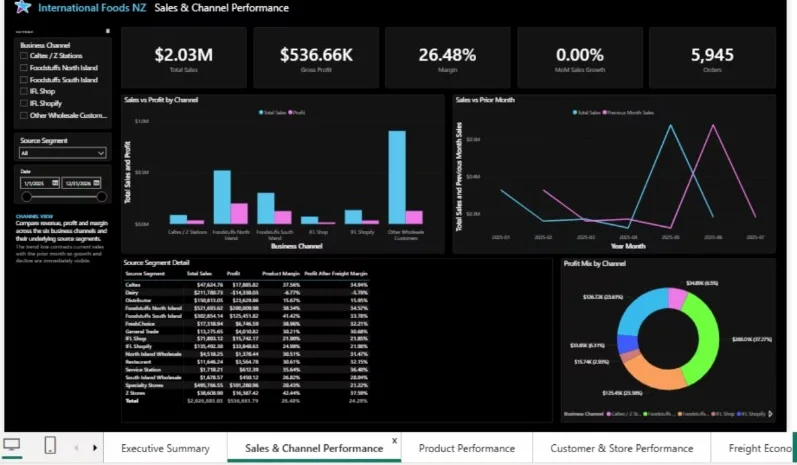
Which products earn their shelf space
Top sellers and quiet margin drains ranked together, with a watchlist that surfaces the lines to reprice or retire before they eat into profit.
Power BIproduct performance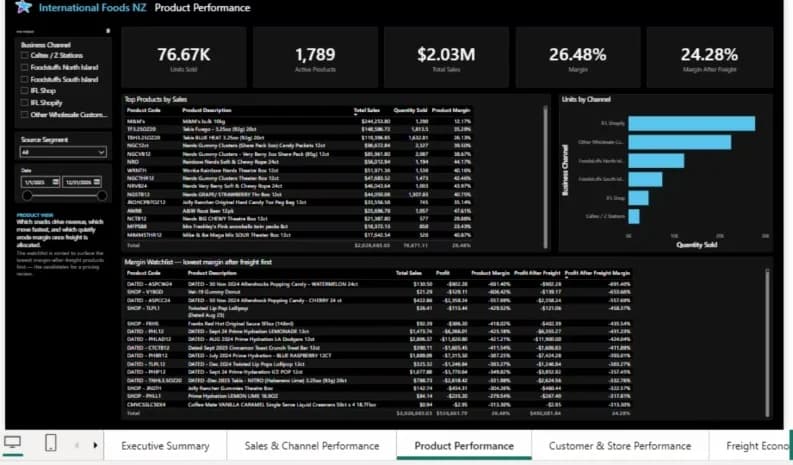
The accounts that carry the margin
Customer and store scorecards rank every account by what it truly contributes, so the team knows who to protect and who to renegotiate.
Power BIcustomer & store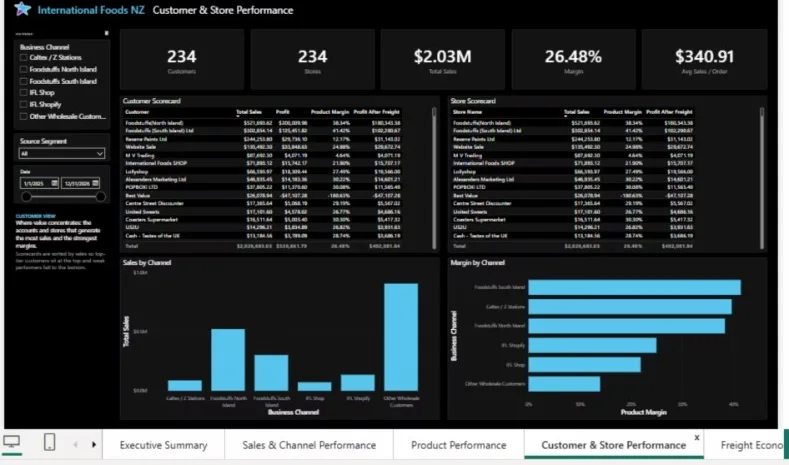
The freight that quietly eats the margin
Freight charged against what the courier actually costs, per channel and per order, exposing the recovery gap that used to disappear into the bottom line. This was the headline finding.
Power BIfreight economics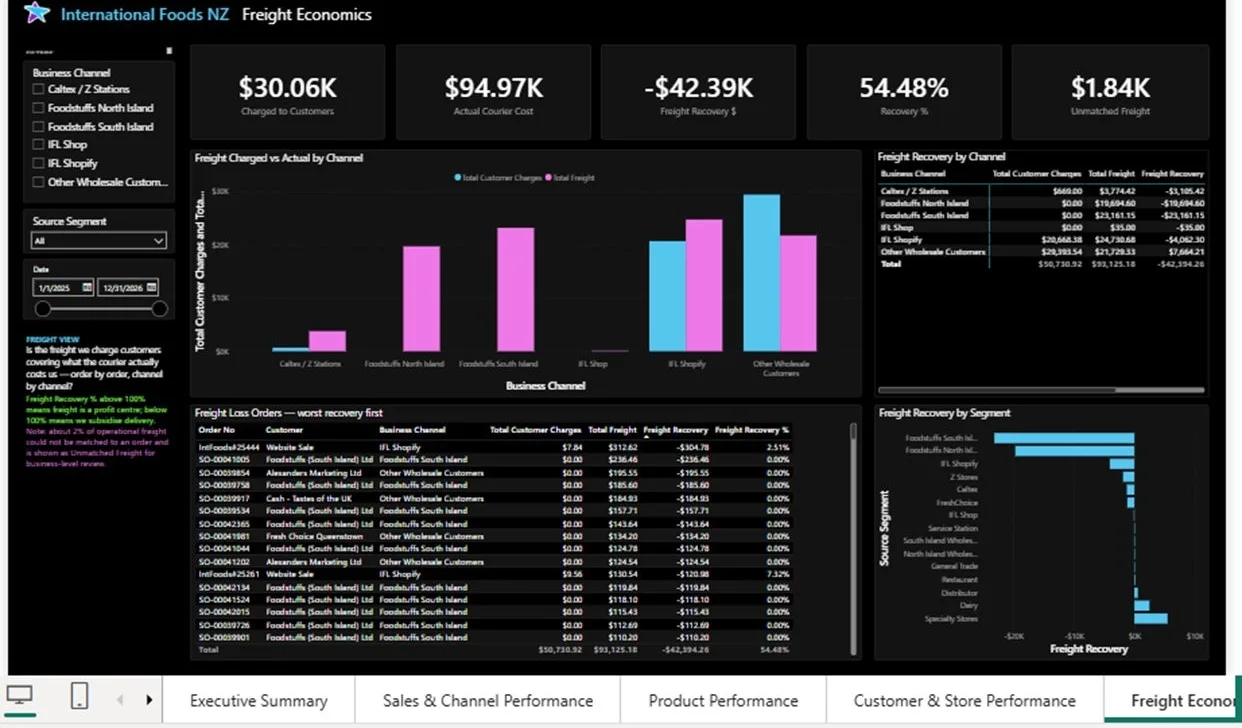
A radar for where money leaks
Negative-profit lines, sub-margin products and credit-note impact in one place, sorted worst first, so the biggest recoverable losses are the first thing the team sees.
Power BImargin & problem areas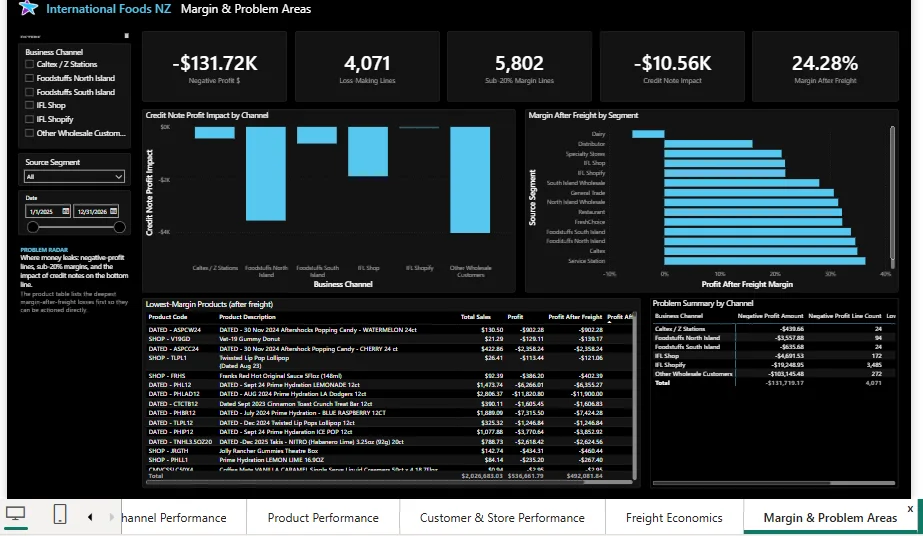
Where it landed
Four systems reconciled into one model
Freight finally tied to every order
Profit by channel, product and customer, on demand
Days of spreadsheet work down to a click
“The profit was always in there somewhere. Now I can see which channels and products actually make money, and which quietly lose it.”

Tell us what eats your week.
A half-hour conversation, no obligation. If we can help, we tell you how. If we can’t, we say so.